
June 28, 2023 | Daily JAM, LNG, UNG, Volatility |
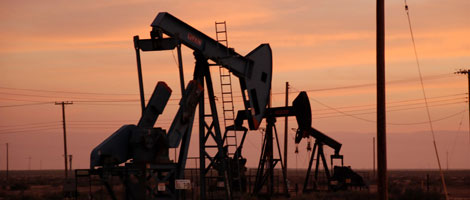
Today’s video is The Long Hot Summer and Natural Gas. If you’ve been following the weather, you know about the huge heat bubble in Texas where temperatures have reached 120 degrees. High temperatures combined with humidity of around 80% can cause serious health problems and even death. The National Weather Service expects this weather to continue and to spread to other parts of the United States, resulting in more and more people staying inside with the air conditioning cranked all the way up. This spike in temperatures is creating a similar spike in natural gas prices. On June 26, we hit a 16-week high for natural gas prices, and July natural gas futures (for July delivery) have been up 14 out of the last 17 sessions. This price surge has two causes ad is operating on two time frames. In the immediate term, the increased air conditioning use stresses the grid, leading to a reliance on natural gas back-ups to supply the energy needed to cover these demand peaks. This, of course, creates a lot more demand for natural gas in the short term. The second thing is a surprising change in long-term thinking about the future of natural gas. I’m seeing a new wave of 20-year supply contracts from places like China and Japan, suggesting countries are thinking that natural gas has a longer future as a transitional fuel as the world moves toward more sustainable energy sources. The two stocks I would look at here are Cheniere Energy, (LNG) and United States Natural Gas Fund, (UNG). Cheniere is up 6% in the last month and is a good way to play the long-term trend in natural gas use. UNG hit a potential bottom in June and is up 16% in the last month. The bigger gain is a result of the ETF being hammered due earlier in the year. UNG is a far more volatile buy, with much higher risk, so if you’re uncomfortable with risk, stick with the more modest but more predictable gains from Cheniere.

April 3, 2023 | Daily JAM, Mid Term, UNG |
This week’s Trend of the Week: A Bottom in Natural Gas? I think so. United States Natural Gas Fund (NYSEARCA: UNG) is down 50% YTD. The problem with UNG is that expectations were that Europe would be buying a lot of gas due to sanctions on Russian commodities. What happened instead was that Europe did a great job finding ways to fill in the gaps and had a fairly mild winter. On March 28, natural gas was trading at $2.08/million BTUs. At $2.50, many natural gas producers are actually losing money. That means we’re going to see companies slow down production. While inventory was down the slightest bit on March 17 from the week before, overall inventory is still way above normal for this point in the year. So right now, as we move into the summer cooling season, and while prices are depressed, it’s a good time to build positions in this commodity.

February 23, 2023 | Daily JAM, UNG, Videos |
Today I posted my two-hundred-and-forty-first YouTube video: Quick Pick U.S. Natural Gas Fund Want to grow your portfolio and protect it too? In the toughest investing market in 40 years? Grab my eBook, Your Best Investing Strategy for the Next 5 Years: Free download for subscribers to JubakAM.com. Just click on the image in the right margin. Today’s Quick Pick is United States Natural Gas Fund (NYSEARCA: UNG). The chart for UNG is horrendous, with a peak in August and a steady plummet after that. For 2022, the stock was up about 12%, thanks to late summer surges in price, as natural gas was bid up under the expectation that the war in Ukraine and sanctions on Russia would cause Europe to run out of natural gas. But year to date for 2023, it’s down 44%, as Europe proved better at replacing Russian gas than anyone had expected. As the end of winter approaches, European natural gas stockpiles are at about 65%–above normal for this time of year. UNG has a pattern of up years following down years–in 2020 UNG saw a 43% decline, and in 2021, a 35% increase. As the price of natural gas goes down, demand spikes as buyers look for the cheapest fuels and purchase more natural gas, which sends the pendulum swinging back upward for natural gas providers and funds that track the commodity. Between now and mid-March is a good time to get in on natural gas as we look for the upswing when China and Asia start looking at cheaper natural gas prices and Europe looks to get its stockpile back to 100%.

January 2, 2023 | Daily JAM |
The stock market in 2022 was extraordinarily event-driven. The Federal Reserve’s decision to, finally, raise interest rates and to raise them fast with four 75 basis point jumps during the year. Russia’s invasion of Ukraine and the resulting shock to energy and food commodity markets. OPEC’s decision to reduce production. The big slowdown in China’s economy as the country first fought Covid with the lockdowns of major cities and industrial regions and then reversed course to no Covid policy at all. The unexpected (by many) ability of Democrats in Congress and the Biden administration to pass legislation with unprecedented levels of spending on clean energy technology and other efforts to slow the rise in global temperatures. 2023 will come with its own set of new (and revisited) market-moving events. Once again I think we’re looking at a year where market trends aren’t determined by revenue and earnings but by big events outside the market itself. Here’s my forecast of the 10 events (or trends or whatever) that will move stocks in 2023. I’ve tried to put them in some rough kind of chronological order so you’ll know when to what for events to unfold and ripple out into the financial markets.

October 25, 2022 | COP, Daily JAM, EQNR, Jubak Picks, PXD, Videos, Volatility |
Today I posted my one-hundred-ninety-sixth YouTube video: Trend of the Week Seasonal Trends in Energy. This week’s Trend of the Week: Seasonal Trends in Energy. There’s a predictable pattern in oil and natural gas prices. In late fall, October to November, you can expect a deep dive to begin and carry on through the winter, with a sharp rise in March and early spring. You can see this trend looking at previous years in the United States Oil Fund (NYSEARCA: USO) and the United States Natural Gas Fund, LP (NYSEARCA: UNG). Right now, we’re heading into that dip in energy prices but you should not sell – in fact, you should be adding to these positions. This seasonal fall in energy prices will allow you to get ahead of the spring bounce. Europe’s energy supply is enough to get through the upcoming winter but, in March, as they look toward next year’s supply, they’ll need to start rebuilding inventories in a market strained by the war in Ukraine, cuts in production, and a hostile OPEC. Stateside, the US Energy Information Administration is projecting record production from the Permian Basin of Texas and Oklahoma, as well as record production of natural gas this year. Even though we’re not seeing a whole lot of capital expenditure, they’re uncapping wells and pumping them harder. Look at USO and UNG as ETF oil and natural gas buys For individual stocks I’d look at Pioneer Natural Resources (NYSE: PXD), ConocoPhillips (NYSE: COP), and EQUINOR (NYSE: EQNR)–all of which I own in portfolios and have no intention of selling anytime soon.

October 19, 2022 | Daily JAM |
China has told its state-owned gas importers to stop reselling LNG to energy-starved buyers in Europe and Asia.
October 5, 2022 | Daily JAM, Morning Briefing, USO |
Today, Wednesday, October 5, OPEC and its allies, including Russia, approved a two million barrel-a-day cut in oil production. This is the largest cut in production since the onset of the pandemic. Here’s the key paragraph in the OPEC+ statement: “Adjust downward the overall production by 2 mb/d, from the August 2022 required production levels, starting November 2022 for OPEC and Non-OPEC Participating Countries as per the attached table.” On the news, oil and oil stocks extended the rally that began on news leaks yesterday.

October 3, 2022 | Daily JAM, Morning Briefing |
All it takes is a report that OPEC+, the group of oil-producing countries that includes Saudi Arabia and Russia, is considering a big cut in production at its meeting this week to send oil and oil stocks off to the races. As of noon New York time on Monday, U.S. benchmark West Texas Intermediate is up 4.21%, and international benchmark Brent crude is higher by 3.75%.

September 21, 2022 | Daily JAM, Morning Briefing |
Faced with the alternative of admitting that recent Ukrainian counter-attacks have sent Russia’s military reeling, Russian President Vladimir Putin has decided to up his game in Ukraine. So far, today, the markets remain focused on the meeting of the Federal Reserve and the U.S. central bank’s decision on interest rates. But I’d try to spare a few brain cells for the likely effects on commodities such as wheat and natural gas from these signs of escalation. Europea natural gas inventories are now at 86% full, just above the 5-year average. That suggests that gas prices will move higher but that this winter won’t see widespread shortages and prices. I think it’s likely to be another story for prices in 2023 when European countries need to scramble to refill these reserves. I own U.S.Natural Gas Fund ETF (UNG) and the Teucrium Corn Fund ETF (CORN) and Teucrium Wheat Fund ETF (WEAT) in my online portfolios. I own all three in my personal portfolios.

August 24, 2022 | Daily JAM, Jubak Picks, UNG, Volatility |
On Tuesday U.S. natural gas prices tumbled after the operators of the Freeport liquefied natural gas terminal said production will resume in early to mid-November instead of October as earlier announced. The terminal, which handles almost 20% of U.S. LNG exports, was knocked out of operation by an explosion in June. The trouble at Freeport has been an especially big deal for European LNG shipments since the United States sends almost 75% of its LNG to Europe and that market has been scrambling to replace natural gas from Russia after that country’s invasion of Ukraine. Natural gas futures dropped 6.5% on Tuesday after hitting $10 per million BTUs for the first time since 2008. Today, Wednesday, August 24, natural gas futures for September delivery are up 2.09% as of 1:30 p.m. New York time.
August 12, 2022 | Daily JAM, LNG, Morning Briefing, TELL, UNG, Volatility |
Yesterday, August 11, U.S. liquefied natural gas (LNG) exported Freeport LNG said it was still pulling in small amounts of natural gas from pipelines at its shuttered LNG export plant in Texas to fuel a power plant. And, this is the important part, it still expects the liquefaction plant, which shut due to a fire on June 8, to return to at least partial service in early October. Thursday, U.S. gas futures jumped about 8% on talk of increased gas flows to the Freeport LNG plant, a drop in gas output, and forecasts for more demand for the fuel over the next two weeks than previously expected. The U.S. Natural Gas Fund (UNG) gained 6.06%.
July 26, 2022 | CORN, Daily JAM, Jubak Picks, UNG, Volatility |
At the close today, July 26, the Teucrium Corn Fund (CORN) was up 2.55% and the Teucrium Wheat Fund (WEAT) was ahead 4.11%. Both of those commodity plays outgained the U.S. Natural Gas Fund (UNG) with its 1.38% move higher. But for consistent gains–and the potential for more–I’d have to say that natural gas is my favorite commodity.